

Impact Dashboard: Ecological & Community Metrics
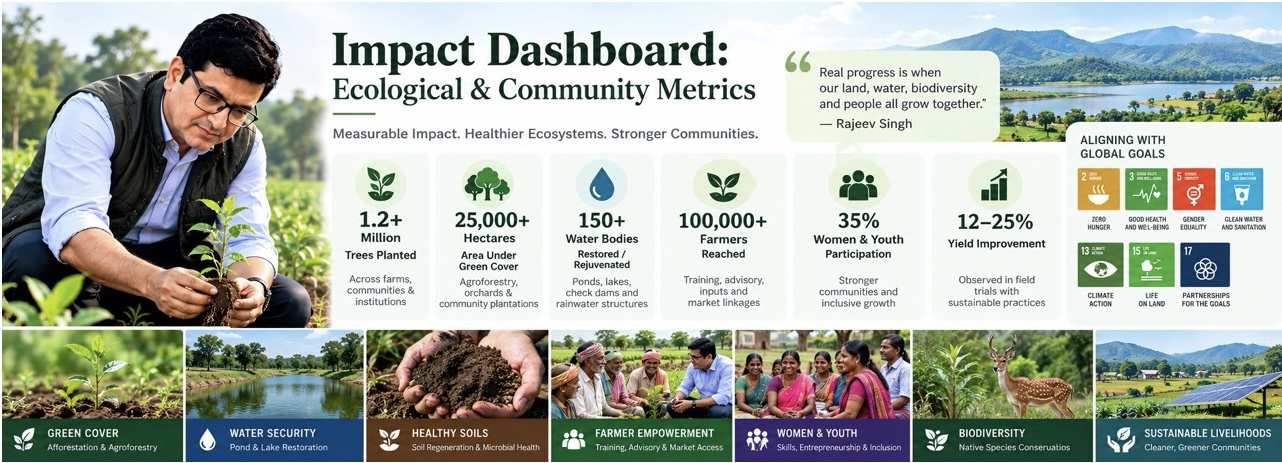
The Impact Dashboard provides a transparent, verifiable window into the real-world outcomes generated across our missions. Grounded in environmental science and grassroots data, this interface tracks how ecological restoration converts directly into community security, soil fertility, and rural resilience across India.
Headline Indicators
These four high-level metrics display at the very top of the page as real-time progress counters:
Quantitative Performance Metrics
Detailed figures broken down by operational sector, showing tangible inputs, outputs, and environmental baselines.
1. Afforestation & Biodiversity Revival
-
Multi-Tier Saplings Distributed & Planted: 520,000+ native saplings (Sal, Karanj, Mahua, Peepal, Neem, Bael).
-
Miyawaki Dense Forests Developed: 18 institutional and urban micro-forest clusters.
-
Canopy Cover Restored: Estimated 340 hectares of green canopy expansion.
-
Sapling Survival Rate: 88.4% average across all field sites (tracked via quarterly geolocated audits).
2. Soil Regeneration & Microbial Farming
-
Farmland Transitioned to Low-Chemical Inputs: 1,200+ acres.
-
Average Soil Organic Carbon (SOC) Improvement: From baseline 0.28% to an average of 0.58% within 24 months.
-
Chemical Fertilizer Offset: Reduction of over 180 metric tons of synthetic NPK inputs annually across target farmer clusters.
-
On-Farm Input Cost Reduction: Average decrease of 45%–65% in cultivation input expenses per marginal acre.
3. Water & Ecological Restoration
-
Water Bodies Rejuvenated: 14 village ponds, natural catchment sumps, and check dams desilted and restored.
-
Rainwater Harvesting Potential Created: ~125 Million Liters of localized percolation and storage capacity annually.
-
Groundwater Recharge Zone Impact: Improved seasonal water-table stability across an 800-meter radius around restored village water bodies.
4. Rural Livelihoods & Micro-Enterprises
-
Decentralized Nurseries Supported: 28 women-led Self-Help Group (SHG) nursery units.
-
Direct Household Income Generated: ₹38+ Lakhs disbursed directly to grassroots SHG members through sapling procurement and composting.
-
Distress Seasonal Migration Reduction: Estimated 420+ rural families retained within local, green micro-economies during dry winter months.
Qualitative Impact Dimensions
Beyond numbers, these qualitative benchmarks evaluate social stability, institutional capacity, and ecological health.
-
Rebuilding Indigenous Trust & Dignity: Tribal healers and village practitioners are treated as co-researchers and primary knowledge holders, restoring community pride in native ethnobotany and traditional healing systems.
-
Financial Autonomy for Women: Transitioning women’s SHGs from mere savings-and-credit circles into self-sustaining ecological enterprises (nursery operations, bio-composting, and seed collection).
-
Reversing Rural Brain Drain: Providing rural youth with scientific agronomic skills (soil diagnostics, microbial culture application, micro-irrigation), positioning them as respected agricultural advisors in their native blocks.
-
Ecological Buffer Development: Establishing resilient biological buffers around mining corridors and industrial outskirts to lower airborne dust levels and restore local wildlife corridors.
Interactive Dashboard Architecture
The frontend of the dashboard is organized into four interactive modules designed for scannability and credibility:
1. Geographic Impact Map (GIS-Enabled)
-
Interactive regional map highlighting active clusters across Jharkhand, Bihar, and adjoining eastern states.
-
Clickable nodes reveal project metadata: location, partner community/SHG, acreage, tree species planted, and baseline vs. current soil data.
2. Before & After Ecological Timelines
-
Visual sliders displaying multi-year satellite and drone imagery of restored degraded tracts, dried-up sumps, and Miyawaki plots.
-
Accompanied by field soil test reports (pH normalization, microbial biomass count, and water infiltration rates).
3. Verification & Third-Party Auditing
-
Open-access downloadable annual audit summaries.
-
Partner university and agricultural institution joint field evaluation reports.
Institutional Partners & Verification
Our impact data is logged from grassroots field reports and validated in coordination with local stakeholders, farmer collectives, and partner academic and research bodies:
[ Village Forest Committees / SHGs ] ──> [ Field Audits & GIS Mapping ] ──> [ SIART